The WATCH facility is a powerful adjunct in server administration. From the
Server Administration facility (9. Server Administration) it provides an
online, real-time, in-browser-window view of request processing in the
running server. The ability to observe live request processing on an ad hoc
basis, without changing server configuration or shutting-down/restarting the
server process, makes this facility a great configuration and problem
resolution tool. It allows (amongst other uses)
assessment of mapping rules
assessment of authorization rules
investigation of request processing problems
observation of script interaction
general observation of server behaviour
A single client per server process can access the WATCH facility at any
one time. It can be used in one of three modes.
As a one-shot, one-off WATCH of a particular request. This is
available from the Request Report page of the Server Administration
facility. In this case the single indicated request is tagged to be WATCHed
in all categories (see below) for the duration of the request (or until the
client stops WATCHing).
As described in this chapter the server and all new requests
being processed are candidates for being WATCHed. Categories are selected
before initiating the WATCH and the report can be generated for a
user-specified number of seconds or aborted at any time using the browser's
stop button.
As a triggered WATCH session where network read (Rx) and write (Tx)
data are searched for a pattern which when hit then activates specified WATCH
session items.
A selector immediately below the duration selector allow the WATCH report to
be targeted at
browser
browser plus log file
log file only (detached)
The Server Administration menu in the date plus run-time statistics panel
(bottom-right) displays a message, "WATCH time-remaining
(bytes-written-to-log)", to alert the administrator any time a WATCH
session is in progress (including but not exclusively when detached).
10.1Server Instances
With a single instance (see 8.1 Server Instances) access to WATCH is
always through the one server process. If multiple instances are configured
WATCH requests, in common with all others, will be serviced by any one of the
associated processes depending on the momentary state of the round-robin
distribution.
This is often an issue for request WATCHing. The simplest scenario
involves two instances. When the WATCH report is activated it will be serviced
by the first process, when the request wishing to be WATCHed is accessed it (in
the absence of any other server activity) will be serviced by the other process
and will not be reported by WATCH on the first.
The solution is to suspend the round-robin request processing for the period
of the WATCH activity. This does not shut any instance down but instead makes
all but the supervisor instance quiescent. (Technically, it dequeues all the
listening I/Os from non-supervisor instance server sockets, making the TCP/IP
network driver send all connection requests to the one instance left with
listening I/Os.) It is just a matter of making the non-supervisor instances
active again when the WATCH activity is concluded.
or using the Server Administration facility
(9. Server Administration) where there are [Active] and [Passive] buttons
available when multiple instances are in use. Neither transition disrupts any
requests being established or in-progress.
10.2Event Categories
An event is considered any significant point for which the server code
has a reporting call provided. These have been selected to provide maximum
information with minimum clutter and impact on server performance. Obvious
examples are connection acceptance and closure, request path resolution, error
report generation, network reads and writes, etc. Events are collected together
into groupings to allow clearly defined areas of interest to be selected for
reporting.
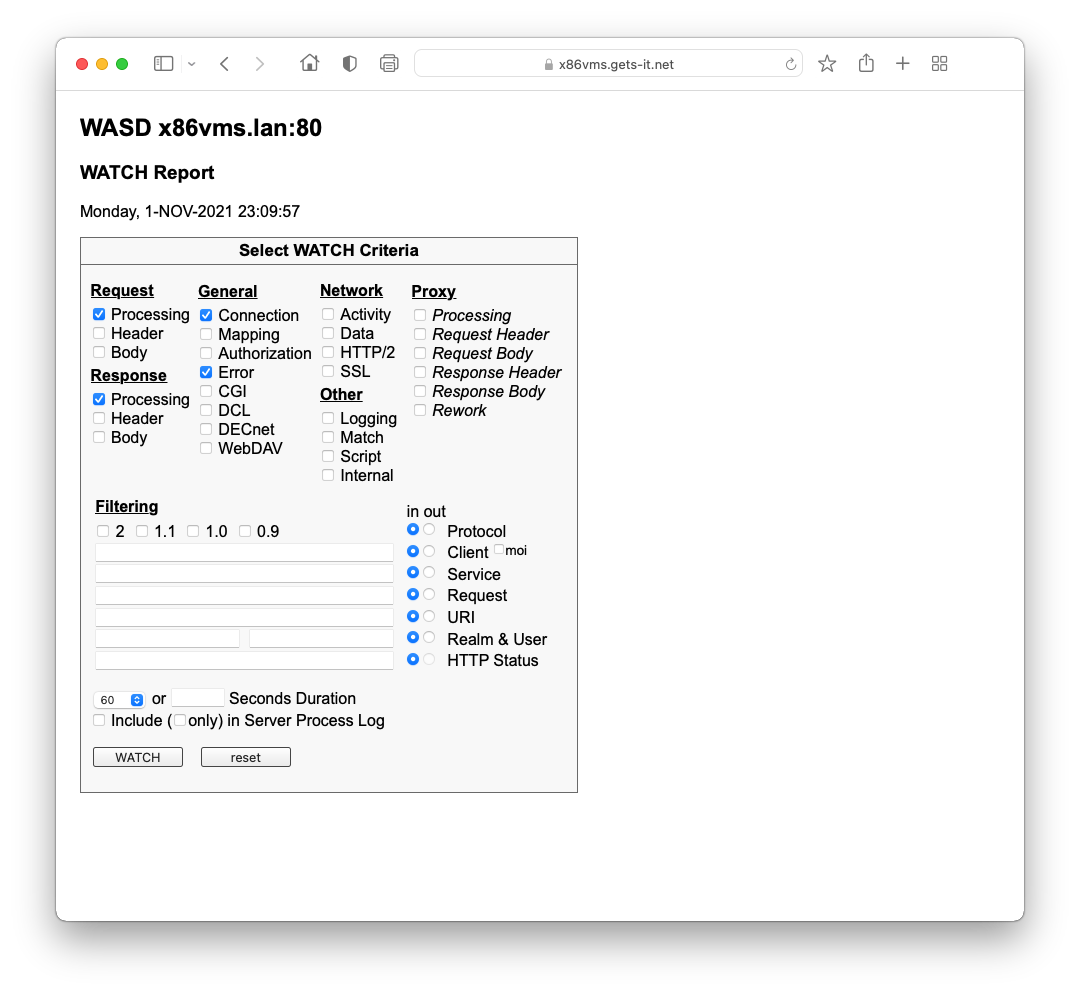
The report menu provides for the inclusion of any combination of the
following categories.
Request
Processing –
Each major step in a request's progress. For example, path resolution and
final response status.
Header –
Provides the HTTP request header as a section of blank-line terminated text.
Body –
The content (if a POST or PUT method) of the request. This is provided as a
hexadecimal dump on the left and with printable characters rendered on the
right, 32 bytes per line.
Response
Processing –
Each major step in generating a response to the request. These generally
reflect calls to a major server module such as file CACHE, FILE access,
INDEX-OF, SSI processing, etc. One or more of these events may occur for each
request. For instance a directory listing will show an INDEX-OF call and then
usually a FILE call as any read-me file is accessed.
Header –
The blank-line terminated HTTP header to the response. Only server-generated
headers are included. Scripts that provide a full HTTP stream do not have the
header explicitly reported. The response body category must be enabled to
observe these (indicated by a STREAM notation).
Body –
The content of the response. This is provided as a hexadecimal dump on the
left and with printable characters rendered on the right, 32 bytes per line.
Some requests also generate very large responses which will clutter output.
Generally this category would be used when investigating specific request
response body problems.
General
Connection –
Each TCP/IP connection acceptance and closure. The connect shows which service
the request is using (scheme, host name and port).
Path Mapping –
This, along with the authorization report, provides one of the most useful
aspects of the WATCH facility. It comprises an event line indicating the path
to be mapped (it can also show a VMS file specification if a reverse-mapping
has been requested). Then as each rule is processed a summary showing current
path, match "Y"/"N" for each path template and any conditional, then the result
and conditional. Finally an event entry shows the resulting path, VMS file
specification, any script name and specification resolved. The path mapping
category allows the administrator to directly assess mapping rule processing
with live or generated traffic.
Authorization –
When authorization is deployed this category shows the rules examined to
determine if a path is controlled, any authentication events in assessing
username and password, and the consequent group, user and request capabilities
(read and/or write) for that path. No password information is displayed.
Error –
The essential elements of a request error report are displayed. This may
include a VMS status value and associated system message.
CGI –
This category displays the generated CGI variable names and values as used by
various forms of scripting and by SSI documents, as well as the processing of
the response header returned by scripts.
DCL –
Debugging scripts can sometimes present particular difficulties. This category
may help. It reports on all input/output streams with the process
(SYS$INPUT, SYS$OUTPUT, SYS$COMMAND, CGIPLUSIN).
WebDAV –
Provides WebDAV specific processing points including request and meta-data XML
associated with resources.
Network
Activity –
For each raw network read and write the VMS status code and size of the I/O is
recorded.
Data –
For each raw network read or write the contents are provided as a hexadecimal
dump on the left and with printable characters rendered on the right, 32 bytes
per line.
HTTP/2 –
Provides a detailed overview of the underlying HTTP/2 framing and connection
management exchanges between client and server. See ‘HTTP/2 and WATCH’ in 5.1 WASD HTTP/2
for further detail.
Proxy –
When proxy tunneling or SOCKS5 is processing this provides the essential steps.
SSL –
If the Secure Sockets Layer image is in use this category provides a indication
of high-level activity.
Other
Logging –
Access logging events include log open, close and flush, as well as request
entries.
DECnet –
For the same reason as above this category reports all DECnet scripting
input/output of the DECnet link. In particular, it allows the observation of
the OSU scripting protocol.
Match –
Shows a significant level of detail during string matching activities. May be
useful during mapping, authorization and conditional processing.
Script –
Sets CGI variable WATCH_SCRIPT allowing a script to explicitly detect this so
as to output specific debugging or other information when being WATCHed.
Internal –
Includes information on other significant internal server processing. Examples
are dictionary entries at various stages of request processing, and the
high-level timing and timeout events occuring within that processing and the
server in general.
Code Modules
If the server has been compiled using the WATCH_MOD=1 macro a set of
module WATCHing statements is included. These provide far more detailed
processing information than available with the generic WATCH, are intended
primarily for debugging the server during development and testing. This is
considered a specialized tool, with the quantity and level of detail produced
most likely proving counter-productive in addressing general site configuration
issues. The module items are shown below the usual WATCH items.
10.3Request Filtering
By default all requests to all services are WATCHed. Fine control may be
exercised over exactly which requests are reported, allowing only a selected
portion of all requests being processed to be concentrated on, even on a live
and busy server. This is done by filtering requests according the following
criteria.
Protocol –
The HTTP protocol being used to transport the request. Multiple protocols may
be selected and concurrently filtered against.
Client –
The originating host name or address. Unless server DNS host name resolution
is enabled this must be expressed in dotted-decimal notation.
The " "
checkbox filters on the WATCHing party's host address.
Service –
The service connected to. This includes the scheme of the service (i.e.
"http:", "https:"), the host name (real or virtual), and the port. The host
name is the official name of the service as reported during server startup.
As the port number is a essential part of the service specification it must
always be explicitly supplied or wildcarded.
Request –
This filter operates on the entire HTTP request header. All fields supplied
with the request are available to be filtered against. As this is a large,
multi-line dataset filters can become quite complex and regular expression (see
String Matching of WASD Configuration)
matching may be useful (see examples below).
URL-encoding allows for non-printing characters (see below).
URI –
This is the string provided by the client and specifying the requested
resource. It includes the resource path along with any query string. It can
contain URL-encoded (sometimes referred to as percent-encoded) characters.
Some characters have alternate encodings, such as the space, as + or %20.
URL-encoding allows for non-printing characters (see below).
Realm & User –
This filters against request authentication information. As authorization
occurs relatively late in request processing some data reported earlier by
WATCH will not be available.
HTTP Status –
This allows a class of response status (1 (informational), 2 (success), 3
(redirection), 4 (client error) and 5 (server error)) or a specific response
status (e.g. 200 (success), 404 (not found), 503 (service unavailable), etc.)
to be filtered into the WATCH report. As this happens very late in request
processing the number of reported events are limited but may provide some
insight into particular processing problems.
In addition there are in and out selectors against each of the
filters which include or exclude the particular request based on it matching
the filter.
These filters are controlled using fully-specified, wildcarded strings or
using regular expression patterns (see
Request processing Configuration of WASD Configuration).
In common with all WASD processing, filter matching is case-insensitive. Of
course, due to the point of application of a particular filter during request
processing, some information may or may not be displayed. When a request is
into or out of the report because of a matching filter a FILTER informational
item is reported.
Examples
This first example shows various strings and patterns that could be
applied to the client filter.
The request filter contains the entire HTTP request header. This includes
multiple, newline-delimited fields. Filtering can be simple or quite complex.
These examples filter all POST requests (either in or out of the report
depending on the respective selector), and all POSTs to the specified script
respectively.
POST *
POST /cgi-bin/example*
These are the equivalent regular expressions but also will stop comparing
at the end of the initial request line. The second, in this case, will also
only filter against HTTP/1.1 version requests (note the final period matching
the <CR> of the <CR><LF> carriage control).
^^POST .*$
^^POST */cgi-bin/example *HTTP/1\.1.$
This example uses a regular expression to constrain the match to a single
header field (line, or newline-delimited string), matching all requests where
the user agent reports using the "Gecko" browser component (Mozilla,
Firefox, etc.)
^^User-agent:.*Gecko.*$
The path and track filter. The path contains a proxied origin server
request and so can be used to filter proxy requests to specific sites.
The authentication filters, realm and user, can be used to select
requests for a particular authenticated user, all authenticated requests or all
non-authenticated requests, amongst other application. The realm field allows
the authenticated user to be further narrowed as necessary. All of the
following examples show only the user field with the default in selector
set.
Authenticated requests for user DANIEL.
DANIEL
All authenticated requests.
%*
10.4Network Triggers
Provides the ability to 'trigger' a WATCH session based on network stream
content. Network stream received (Rx) and transmitted (Tx) can be searched for
the presence of a character sequence. Unlike the filters this a not a wildcard
string and is case-sensitive. Network triggers (understandably) add
significant overhead to WATCH processing.
Triggering can be a useful tool. Long (or short) WATCH sessions, detached as
required, lying in wait to activate the WATCH session when a particular
sequence of characters is present in the network stream. Clear and encrypted
(TLS/SSL) network streams are obvious and easy to process. HTTP/2 streams a
little less obvious due to framing and encoding of data. WATCHing an HTTP/2
receive stream requires using a decoded header plus any body supplied with the
request. WATCHing transmit, the HTTP/2 unencoded response header plus response
body output frames.
URL-encoding allows for non-printing characters (see below).
For TLS encypted network data only the cleartext is searched.
Hence, data before handsake completion cannot be a trigger.
Selection of a trigger can be exacting. Some triggers can result in unwanted
collection. For example, a receive trigger of "Firefox/" to capture all
related browser traffic may result in also capturing the WATCH Report header
and/or any traffic of the WATCHing browser if also Firefox. The former issue
can be worked around by URL-encoding some part of the trigger sequence, as in
"%46irefox/". The latter by using another variety of browser.
The bottom-line is that selecting an effective trigger requires some care.
Trigger Plus
Triggers are applied on a per-request basis, though can be checked as
+
and this implies once triggered, the connection, HTTP/2 and HTTP/1.1
persistent, from then on WATCHes are applied to all subsequent requests on that
connection. Transmit (Tx) triggers generally occur quite late in a request
life-cycle but the plus checkbox can be used to WATCH subsequent requests.
URL Encoding
Indicated filters and the triggers can be URL-encoded to allow non-printing
characters to be included. This means that the plus symbol ("+") and
percentage symbol ("%") themselves should be encoded when used in a pattern,
%2b and %25 respectively. A carriage-return plus line-feed sequence
would be represented %0d%0a. It provides for more complex binary
containing, or even binary only, sequences to be constructed.
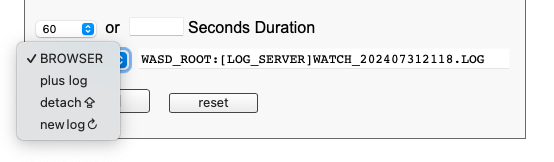
10.5Report Target
Below the "Select WATCH Criteria" items, the Filters and Triggers, are the
duration of the WATCH session (basically in seconds), a selector for the
target of the report, a name for a file target, and the begin to
WATCH button.
BROWSER – the report is delivered to the current browser page.
plus log – delivered to the current browser page plus
written to a log file using the current log file name.
detach ⇪ – the report is written to the specified
log file name detached from the browser for the duration specified.
new log ↻ – a new log file name is generated.
A log file cannot be overwritten. A new log file name must be generated or
specified.
A log file is flushed once per minute, or by using
HTTPD/DO=WATCH=FLUSH at the command line.
A log file may be command line TYPEd at any time but as noted above only
lists output up to when most recently flushed.
Log File Name
The log file name is generated automatically when entering "Select WATCH
Criteria". The default file name comprises the server process log file
location plus the string "WATCH_" plus a timestamp to the minute
plus ".LOG". A new log file name can be generated at any time
using the [new log ↻] selector. A log file name may be
manually entered. The log file location must have write access available to
the server account.
Detach Mode
The default mode delivers to the browser page and anytime the browser page
changes location, is halted, or otherwise closes the report in some fashion the
report terminates. Detached mode runs the WATCH independent of the browser for
the duration specified in the selection criteria. When operating in detach
mode the report may be terminated by accessing the WATCH selection page and
clicking the presented
END!
button, or by using HTTPD/DO=WATCH=END at the command line.
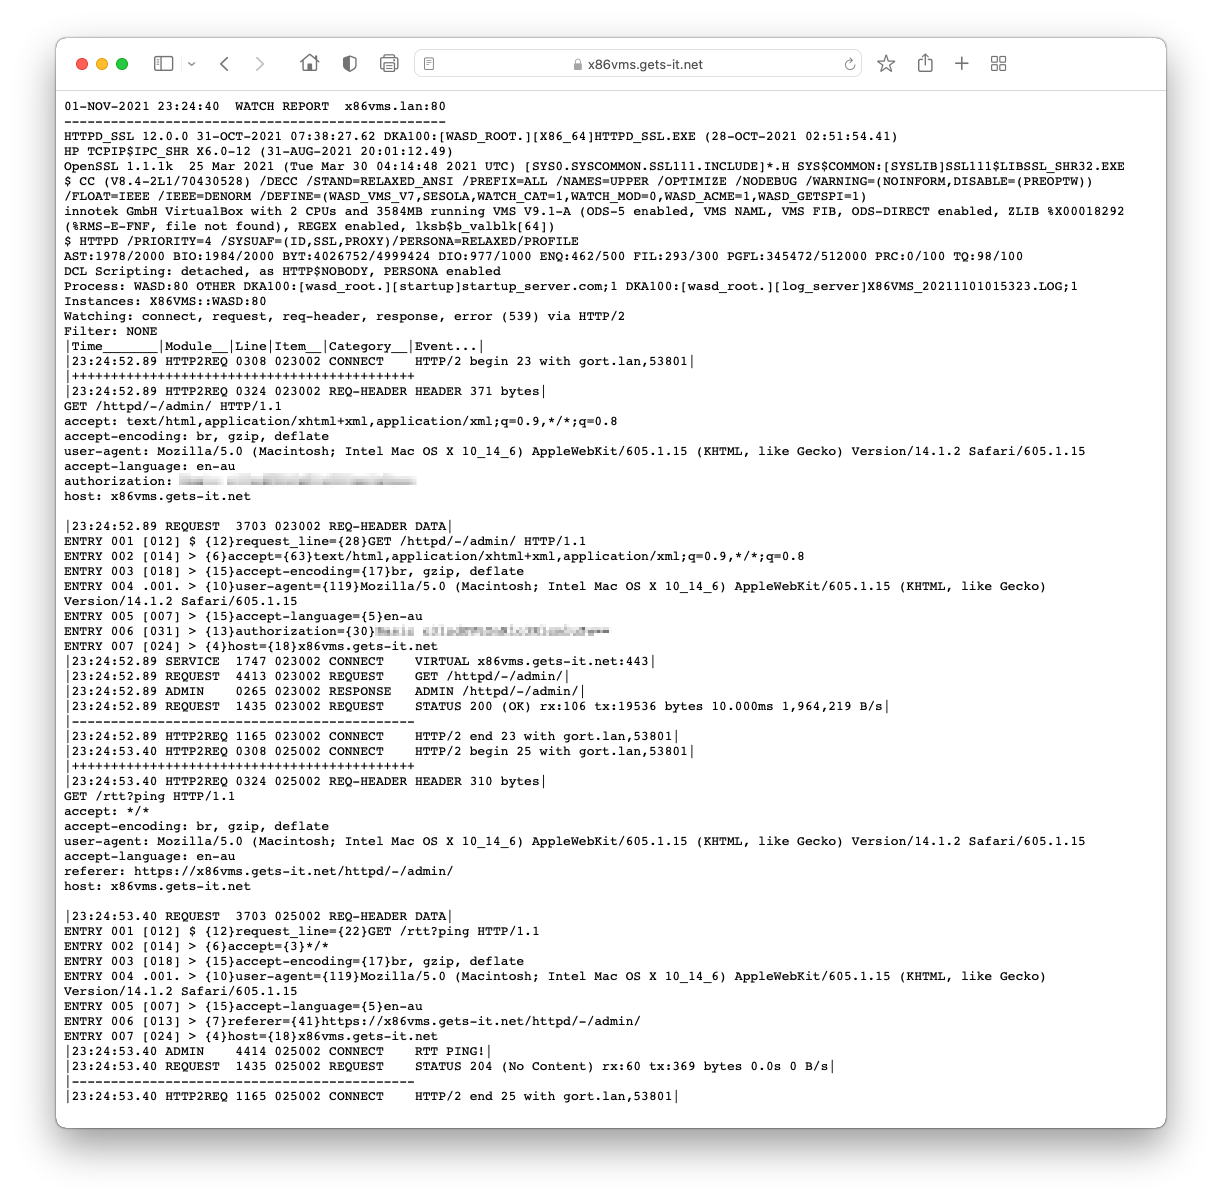
10.6Report Format
The following example illustrates the format of the WATCH report. It begins
with multi-line heading. The first two record the date, time and official
server name, with underline. The third provides the WASD server version. The
fourth provides some TCP/IP agent information. Lines following can show
OpenSSL version (if deployed), system information, server startup command-line,
and then current server process quotas. The last three lines of the header
provide a list of the categories being recorded, the filters in use, and the
last, column headings described as follows:
time the event was recorded
the module name of the originating source code
the line in the code module
a unique item number for each thread being WATCHed
event category name
free-form, but generally interpretable event data
Note that some items also include a block of data. The request header
category does this, providing the blank-line terminated text comprising the
HTTP header. Rule mapping also provides a block of information representing
each rule as it is interpreted. Generally WATCH-generated information can be
distinguished from other data by the uniform format and delimiting vertical
bars. Initiative and imagination is sometimes required to interpret the
free-form data but a basic understanding of HTTP serving and a little
consideration is generally all that is required to deduce the essentials of any
report.
When defined logical name WASD_WATCH_ONE_SHOT specifies the items shown in a
one-shot WATCH. Without the logical name all items are displayed. For example
$ DEFINE /SYSTEM WASD_WATCH_ONE_SHOT 67109395
displays items connect, request, response, error, http/2 instead of all.
The integer representing these items can be found in the WATCH report
header. See "|Watching: …" in examples above.
10.8Usage Suggestions
The following provides a brief explanation on the way WATCH operates and
any usage implications.
A single client may be connected to the WATCH facility at any given time.
When connecting the client is sent an HTTP response header and the WATCH report
heading lines. The request then remains connected until the WATCH duration
expires or the client overtly aborts the connection. During this period the
browser behaves as if receiving a sometimes very slow, sometimes stalled,
plain-text document. As the server processes WATCHable events the text
generated is sent to the WATCH-connected client.
If the connection is aborted by the user some browsers will consider
document retrieval to be incomplete and attempt to reconnect to the service if
an attempt is made to print or save the resulting document. As the printing of
WATCH information is often quite valuable during problem resolution this
behaviour can result in loss of information and generally be quite annoying.
Appropriate use of the duration selector when requesting a report can work
around this, as at expiry the server disconnects, browsers generally
interpreting this as legitimate end-of-document (when no content-length has
been specified).
During report processing some browsers may not immediately update the
on-screen information to reflect received data without some application
activity. If scroll-bars are present on the document window manipulating
either the horizonal or vertical slider will often accomplish this. Failing
that minimizing then restoring the application will usually result in the most
recent information being visible.
Browser reload/refresh may be used to restart the report. A browser will
quite commonly attempt to remain at the current position in the document, which
with a WATCH report's sustained but largely indeterminate data stream may take
some time to reach. It is suggested the user ensure that any vertical
scroll-bar is at the beginning of the current report, then refresh the report.
Selecting a large number of categories, those that generate copious output
for a single event (e.g. response body) or collecting for extended periods
can all result in the receipt of massive reports. Some browsers do not cope
well with documents megabytes in size.
Note
WATCH reports are written using non-blocking I/O into an internal buffer. This
buffer is written when filled, or flushed at a one second interval. Slight
latency may be experienced with sporadic WATCH report items.
When supplying WATCH output as part of a problem report
please ZIP the file and include it an an e-mail attachment. Mailers often
mangle the report format making it difficult to interpret.
10.9Command-Line Use
Although intended primarily as a tool for online use WATCH can be deployed
at server startup with a command-line qualifier and provide report output to
the server process log. This is slightly more cumbersome than the Web interface
but may still be useful in some circumstances. Full control over event
categories and filters is possible.
/NOWATCH Disables the use of the online WATCH facility.
/WATCH= Enables the server WATCH facility, dumping to
standard output (and the server process log if detached). When in effect the
online facility is unavailable. The string supplied to the qualifier may
comprise four comma-separated components. Only the first is manadatory.
Stated order is essential. It will probably be necessary to enclose the
complete string in quotation marks.
LIST –
The LIST keyword provides a list of all the categories (items) available for
WATCHing.
NOSTARTUP –
This keyword suppresses WATCH output until the server is ready to process
requests. It must be the leading keyword.
items –
A parenthesized, comma-separated list of category keywords. Available keywords
can be displayed using the LIST facility.
filters –
A client, service and path filters can be provided following the specification
of required items. They must be provided in the order listed above. Leading
filters that are not required must be provided as single, asterisk wildcards.
WATCH parameter with filters containing forward-slashes will require quoting.
The following examples illustrate the command-line WATCH specification.